Modelling the Overview
The visual identity for X is Not a Small Country
by Joana Pestana and Max Ryan
The visual identity associated with the exhibition X is Not a Small Country attempts to embody the complexity of post-global relationships in symbolic terms, taking data from application programme interfaces (APIs) tied to assorted topical global issues and formulating rhythmic, relational graphics from them.
Around the time of writing this, Jeff Bezos, the billionaire founder of Amazon, had just returned from space* and spoke indirectly of experiencing some version of the “overview effect”, and of how there were “no boundaries, no lines, no national state… and when you get up there, you see we are one world, one planet, [so] we should have a lot of unifiers”. He immediately followed this up by emphasising the need for private ventures in space, allegedly in the interests of protecting the planet, transferring the negative effects of our current modes of living to outer space instead of confronting the problematic aspects of the global systems in which we all participate (see the MONIAC reference below).
The fantasy of no borders is a frequent one for global corporations as transnational flows of capital and labour are interrupted by the re-establishment of hard boundaries and the development of competing national sectors (many of the artists taking part in X is Not a Small Country explore themes related to borders and impediments, which the exhibition’s visual identity attempts to complement). Covid-19 has, of course, been a hard reminder of the reality of national boundaries, a fact that Trump, in his withdrawal from the World Trade Organization and the trade wars he began, previously hinted at. The emergence of multiple centres of power and their competition for systemic dominance, alongside accelerating technological development and hyperobjects, including climate change, has resulted in a more obviously unpredictable world. Systems are colliding at many scales. Black swan events are no longer uncommon, and under these conditions, narrative becomes a form of understanding complexity.
Our aim with the visual identity of X is Not a Small Country was to provoke the formation of open-ended, unpredictable narratives through the juxtaposition of the many relational data graphics present within each of its instances. The data sources come from disparate areas of the globe, and the data will have been produced, or extracted, under different regimes. Through comparison and forced connection, the narratives are intertwined with abstracted, nascent landscapes that implicate locations within global systems.
* Prior to his space flight, we entertained thoughts of a different Bezos returning from the heavens, changed by his experience of the overview and messianic in his intentions to bring about (hopefully positive) global change.
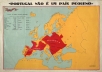
MONIAC
Bill Philips, 1949.
 |
The MONIAC (Monetary National Income Analogue Computer) machine was created by Bill Phillips in 1949 as an attempt to model economic systems at an abstract macro-level through hydraulics. The water represented the monetary “flows” of the economy, and this was informed by Paul Samuelson’s Circular Flow diagram. In many ways, the MONIAC was this diagram made “flesh”. The ideas it represented have since been superseded by more probabilistic methods, but as a model, it could be considered symbolic of more embedded attitudes. As Kate Raworth points out in her book Doughnut Economics, neither the Circular Flow diagram nor the MONIAC system accounted for what was in the in-between spaces of the system, nor how the system was powered. These were unnecessary externalities unworthy of consideration. The influence of ideal diagrammatic understandings of the world is, we have found, something to be questioned.
Complex Net Art Diagram
Abe Linkoln (Rick Silva), 2003.
 [Scroll over the image] |
The original Simple Net Art Diagram (1997) by the artists MTAA almost became a meme due to the myriad times it was exchanged and reinterpreted. The diagram communicated the idea of an in-between, liminal, location for meaning within a network. Designed to be scrolled through, the later version, by Abe Linkoln, introduced wilful complexity into this previously simple-seeming relationship, incorporating myriad schematics and diagrams between the two computers’ terminals, and hinting at systems and interconnections beyond that of the simple user-to-user relationship.
Black Shoals: Stock Market Planetarium
Autogena Projects (Lise Autogena and Joshua Portway), 2015.
 |
Black Shoals is an artwork by Autogena Projects that both engages with and visualises the complexities of the financial markets. Companies become stars that gradually cluster together into galaxies representing industries, while an ecology of artificial creatures feed upon trading activity. As an artwork, it deals with notions of emergence, with a system of rules tied to a shifting external world of inputs through stock market data, leading to unexpected intricacies in what is shown.
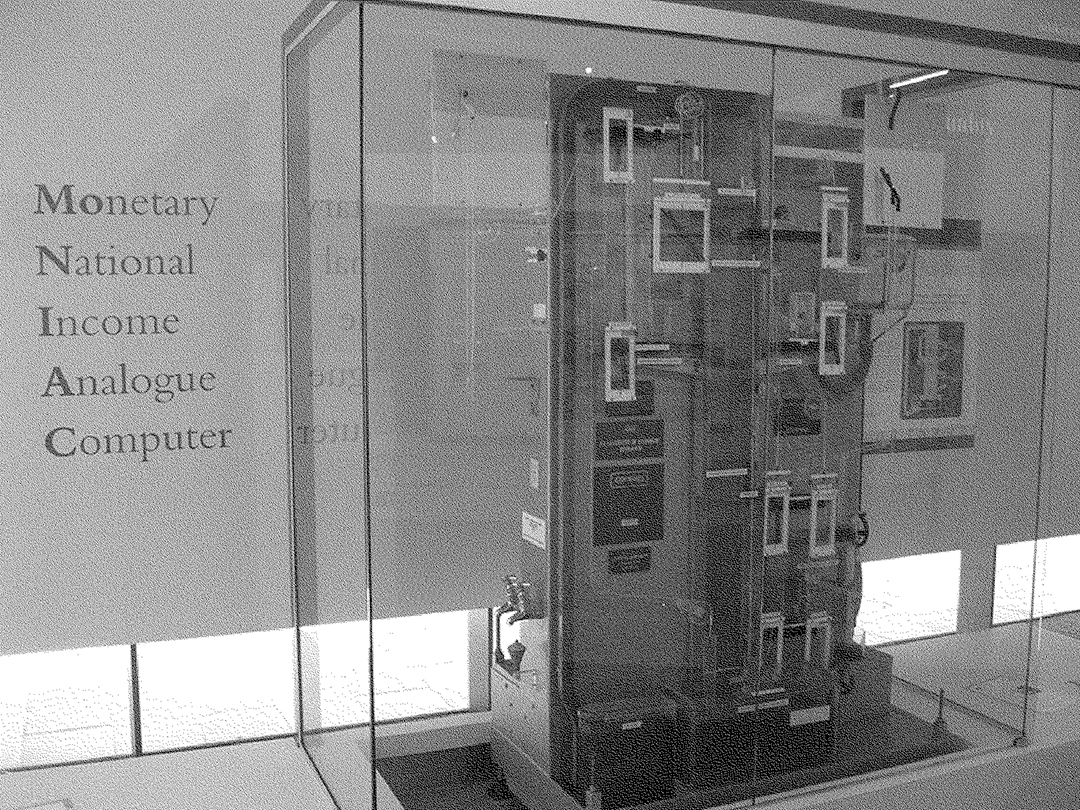
Cartographies of Time: A History of the Timeline
Daniel Rosenberg and Anthony Grafton — Princeton Architectural Press, 2012.
 |
Ideas of time and mapping relationships over time are implicit in the graphics of this visual identity. Data is pulled in from the immediate past year and visualised whenever the tool is used, with satellite imagery of one location gathered across the same time period ready to be merged. The book, Cartographies of Time, provides a compendium of references and history to draw upon and consider in the positioning of the project. An individual snapshot of a system is meaningless; each moment in time has to be judged in relation to another in order to extract meaning.
Monochrome Landscapes
Laura Kurgan, 2004.
Monochrome Landscapes is a set of four rectangular Cibachrome prints of images taken by the commercial satellites Ikonos and Quickbird, each showing a different view. The satellite images reveal nothing by themselves, but through the details in their captions implicate wider struggles over contested territories. Rather than something separate, the abstract colours and forms of the landscapes shown become part of the conversation surrounding the artwork.
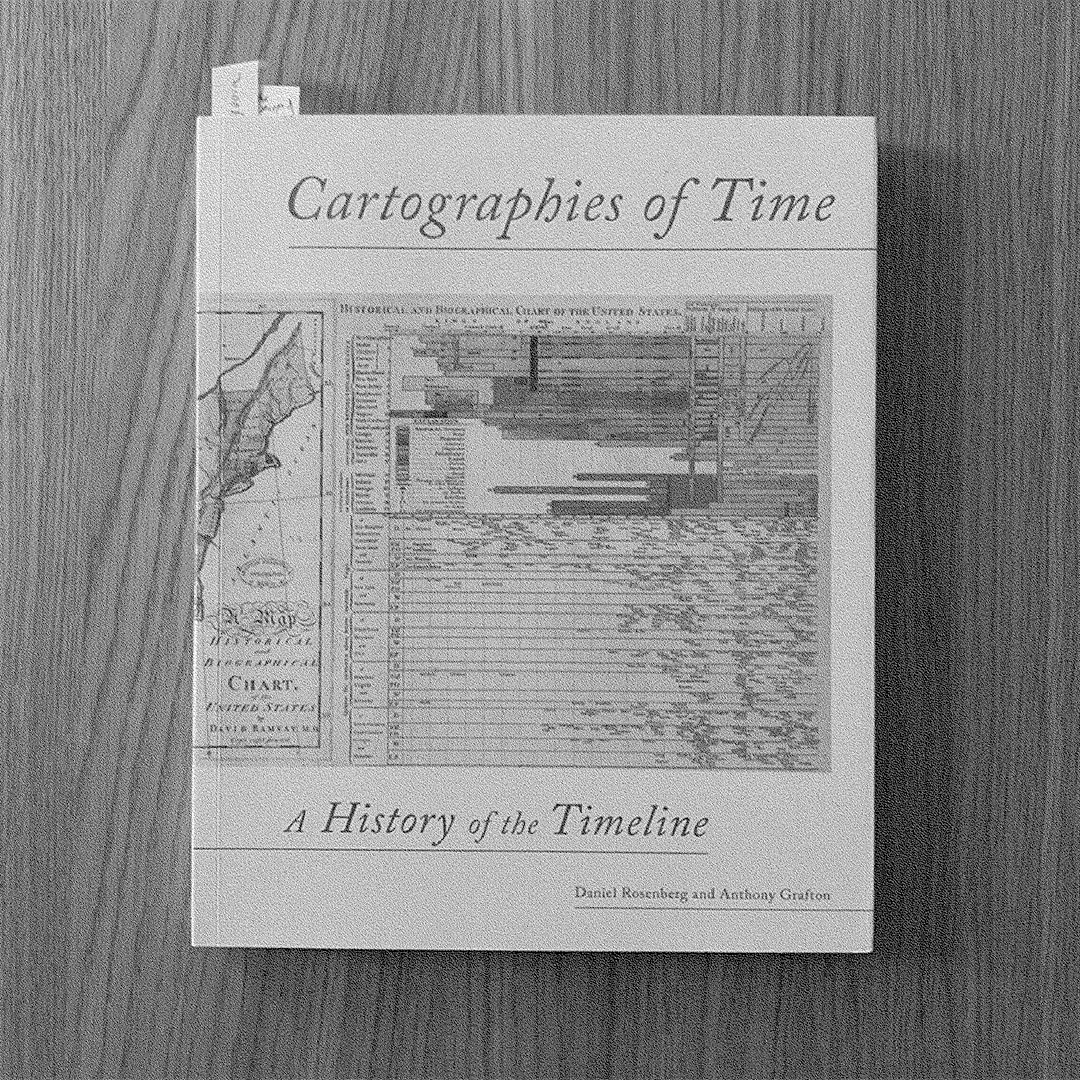
Chronique universelle
Anonymous, ca. 1440.
 |
The circle is a common visual element of many early genealogical trees. For example, circles were used as leaves on branches on some of the diagrams of the 34-foot 15th-century scroll Chronique universelle. This manuscript draws upon sacred and secular sources to tell the history of the world from Creation through to the year 1380. In this humanistic and encyclopaedic project, biblical stories, tales of ancient Greece and Rome, and stories of the royal houses of France and England are brought together. The formal aspects of these early tree diagrams, their mixing of source materials, and the resulting complexity and divergent modes of navigation and interpretation inspired elements of the rationale behind the project.
Powers of Ten
Ray and Charles Eames, 1977.
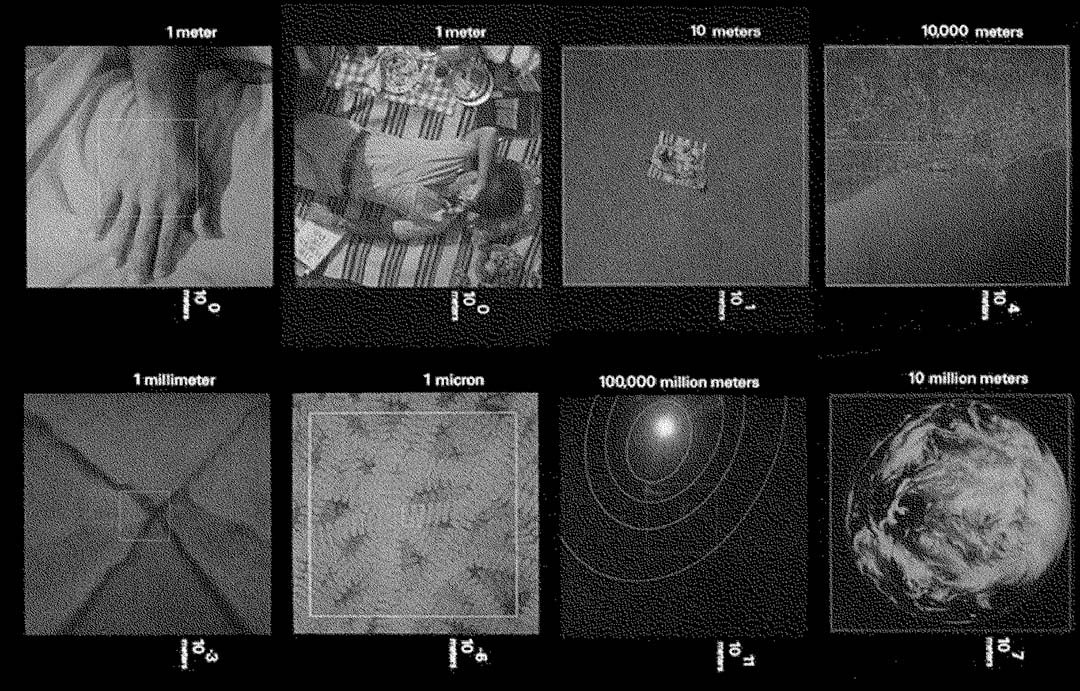 |
Scaling, metrics and relational systems are famously illustrated in the 9-minute video developed by designers Ray and Charles Eames for IBM. Starting with a picnic scene, the camera moves further away – 1 meter, 10 meters, 10,000 meters – until eventually reaching outer space. We then witness this movement in reverse, hurtling inward, towards the nanoscale, and ending inside an atom of carbon.
The Overview Effect
Frank White — American Institute of Aeronautics and Astronautics, Reston, 1987.
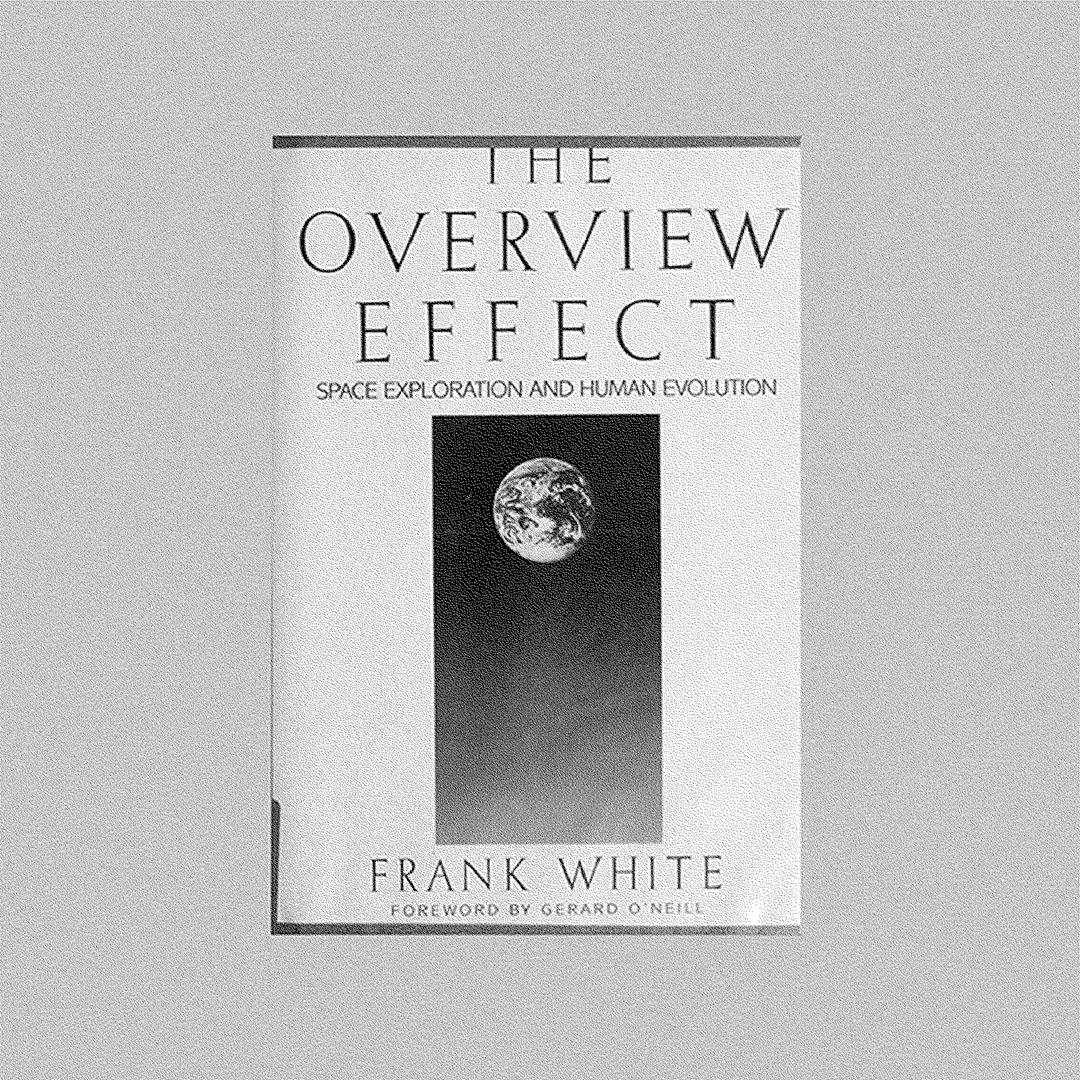 |
The “overview effect” is a term coined in 1987 by “space philosopher” Frank White to describe the cognitive shift experienced by astronauts when looking down at the Earth from space. From this privileged perspective, they are said to perceive Earth as a unified whole, with no physical borders or geopolitical boundaries. It is a realisation that all entities on Earth form one organic system and can be understood on an equal level. This shift in personal perspective is referenced heavily in the visual identity through the use of satellite imagery.
|
Joana Pestana and Max Ryan met at the Royal College of Art in 2014. During the course of their studies they began working together on workshops and side-projects critiquing graphic design and its relationship with technology such as “Post-Eady” (2016) and “Critical GPS” (2018). These sites of shared interest eventually led to collaborations on design projects and the on-going discursive project, scripted.space. Both have taught across various universities and consider education and pedagogy as an inherent part of their practices.
|
Curated by Aric Chen, with Martina Muzi, X is Not a Small Country – Unravelling the Post-Global Era (maat, 18/03 – 06/09/2021) includes nine newly created projects by international practitioners working across the fields of design, architecture and art who investigate, articulate and critique the current convoluted state of the world from multiple geographic perspectives.
|
|
An identity tool created by the designers Joana Pestana and Max Ryan to scan and select satellites and imagery for use in the visual identity. |
The identity tool that generates the rhythmic data motifs used throughout the visuals. Each instance randomly selects from a collection of topics and associated APIs. |

The visual imagery of landscapes and data narratives used on the “X is Not a Small Country” booklet published by maat. Photo: Lisa H. Moura.